ꯐꯥꯏꯜ:Vladimir Putin approval (Levada, 2020).png
.png)
ꯃꯁꯤꯒꯤ ꯄ꯭ꯔꯚꯤꯌꯨ ꯑꯁꯤꯒꯤ ꯁꯥꯏꯓ: ২২০ × ১২০ ꯄꯤꯛꯆꯦꯜꯁ. ꯑꯇꯩ ꯁꯦꯡꯅ ꯌꯦꯡꯕ ꯌꯥꯕ: ৩২০ × ১৭৪ ꯄꯤꯛꯆꯦꯜꯁ | ১,৯২০ × ১,০৪৬ ꯄꯤꯛꯆꯦꯜꯁ.
ꯐꯥꯏꯜ ꯑꯁꯦꯡꯕ (১,৯২০ × ১,০৪৬ ꯄꯤꯛꯆꯦꯜꯁ, ꯐꯥꯏꯜ ꯆꯥꯎꯕꯒꯤ ꯆꯥꯡ: ৯৫ KB, MIME ꯃꯈꯜ: image/png)
.png)
ꯑꯇꯦꯟꯕꯥ ꯁꯟꯗꯣꯛꯅꯥ ꯇꯥꯛꯄꯥ
| ꯁꯟꯗꯣꯛꯅꯥ ꯇꯥꯛꯄꯥVladimir Putin approval (Levada, 2020).png |
English: Chart of Vladimir Putin approval for the whole data set published by Levada Centr https://www.levada.ru/indikatory/odobrenie-organov-vlasti/ |
| ꯆꯩꯆꯠ | |
| ꯍꯧꯔꯛꯐꯛ | ꯏꯁꯥ ꯏꯊꯟꯇꯒꯤ ꯑꯣꯏꯕꯥ ꯊꯕꯛ |
| ꯄꯨꯊꯣꯛꯂꯤꯕ ꯃꯤ | Cloud200 |
ꯑꯌꯥꯕꯥ
I, the copyright holder of this work, hereby publish it under the following license:


This file is licensed under the Creative Commons Attribution-Share Alike 4.0 International license.
- ꯅꯪꯒꯤ ꯀꯨꯁꯤ:
- ꯃꯌꯥꯝꯗꯥ ꯐꯪꯍꯟꯕꯥ – ꯊꯥꯕꯛ ꯑꯗꯨ ꯁꯤꯟꯖꯤꯟꯕꯥ, ꯌꯦꯟꯊꯣꯛ ꯎ ꯑꯃꯥꯗꯤ ꯃꯐꯝ ꯱ ꯗꯥ ꯆꯠꯍꯟꯂꯨ
- ꯑꯃꯨꯛꯀꯥ ꯌꯥꯟꯁꯤꯟꯅꯍꯟꯕꯥ – ꯊꯥꯕꯛꯇꯨꯒꯥ ꯆꯨꯁꯤꯟꯅꯍꯟꯕꯥ
- ꯃꯈꯥꯒꯤ ꯌꯥꯅꯕꯒꯤ ꯃꯈꯥ ꯄꯣꯟꯅ:
- ꯈꯣꯝꯒꯠꯂꯛꯄꯥ – ꯅꯪꯅ ꯆꯞꯆꯥꯕ ꯇꯧꯕꯤꯃꯜ ꯄꯤꯕꯤꯒꯗꯕꯅꯤ, ꯑꯌꯥꯕ ꯄꯤꯔꯤꯕꯁꯤꯡꯒ ꯁꯝꯅꯐꯝ ꯄꯤꯒꯗꯕꯅꯤ ꯑꯃꯁꯨꯡ ꯑꯍꯣꯡꯕ ꯈꯔꯥ ꯂꯩꯔꯗꯤ ꯃꯗꯨ ꯎꯠꯀꯗꯕꯅꯤ ꯫ ꯅꯪꯅ ꯃꯗꯨ ꯃꯔꯝ ꯂꯩꯅ ꯇꯧꯒꯗꯕꯅꯤ, ꯑꯗꯨꯕꯨ ꯑꯌꯥꯕ ꯄꯥꯏꯔꯤꯕꯗꯨꯅ ꯍꯥꯏꯔꯛꯄ ꯃꯑꯣꯡ ꯅꯠꯇ꯭ꯔꯒ ꯅꯪꯅ ꯁꯤꯖꯤꯟꯅꯕ ꯃꯑꯣꯡꯗ ꯇꯧꯔꯣꯏꯗꯕꯅꯤ ꯫
- ꯃꯥꯟꯅꯕꯥ ꯁꯥꯔꯨꯛ – ꯀꯔꯤꯒꯨꯝꯅ ꯅꯪꯅ ꯌꯥꯟꯁꯤꯟꯅꯔꯕ, ꯍꯣꯡꯗꯣꯛꯍꯟꯂꯕ, ꯅꯠꯇ꯭ꯔꯒ ꯄꯣꯠꯆꯪꯁꯤꯡ ꯁꯥꯒꯠꯂꯕꯗꯤ, ꯅꯪꯒꯤ ꯍꯣꯠꯅꯖꯃꯟ ꯑꯗꯨ ꯃꯁꯤꯒꯤ same or compatible licenseꯒꯤ
Code
Python3 code used to generate this graph. Data is copied manually from Levada.ru and saved into two separate ASCII files:
- approval.txt - approval (%) formatted as comma-separated integers (31,53,65...)
- dates.txt - dates of the corresponding approval polls formatted as comma-separated MM.YYYY strings (08.1999,09.1999,10.1999,11.1999...)
from numpy import loadtxt
from matplotlib import pyplot as plt

approval = loadtxt('approval.txt',delimiter=',')
dates = loadtxt('dates.txt',delimiter=',',dtype=str)
dates2 = [datetime.datetime.strptime(x, '%m.%Y') for x in dates]
x = dates2
y = approval
plt.plot(x,y)
plt.ylabel('Approval %')
plt.title('Vladimir Putin approval percentage (Levada, closed question)')
plt.grid(True)
plt.show()
Captions
Add a one-line explanation of what this file represents
ꯐꯥꯏꯜꯒꯤ ꯄꯨꯋꯥꯔꯤ
ꯆꯩꯆꯠ/ꯃꯇꯝꯗ ꯅꯝꯃꯨ ꯃꯇꯝ ꯑꯗꯨꯗ ꯐꯥꯏꯜ ꯑꯗꯨ ꯎꯅꯕ
| ꯆꯩꯆꯠ/ꯃꯇꯝ | ꯈꯨꯠꯄꯤꯈꯨꯖꯤꯟ | ꯄꯥꯛ ꯆꯥꯎꯕꯥ | ꯁꯤꯖꯤꯟꯅꯔꯤꯕ | ꯑꯄꯥꯝꯕ ꯐꯣꯡꯗꯣꯛ ꯎ | |
|---|---|---|---|---|---|
| ꯍꯧꯖꯤꯛꯀꯤ | ꯰꯴:꯱꯷, ꯲꯶ ꯃꯦ ꯲꯰꯲꯰ | 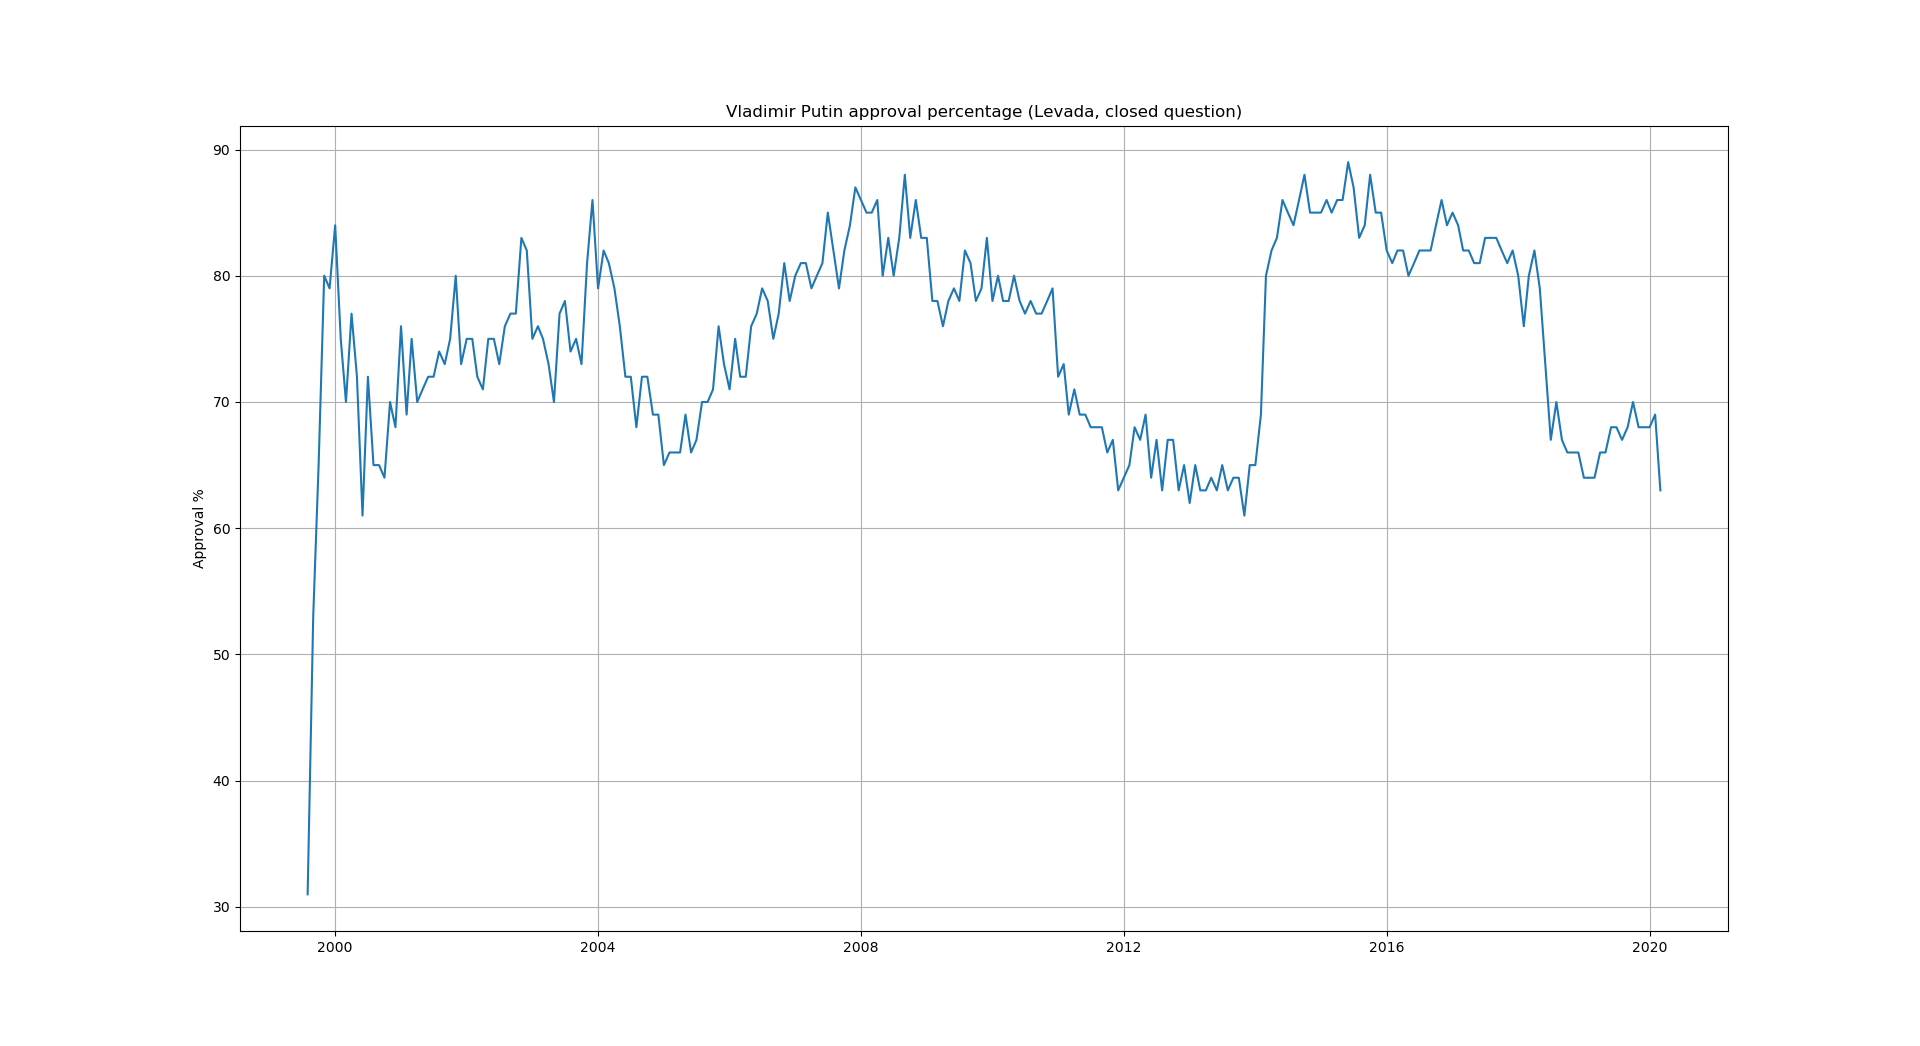 | ১,৯২০ × ১,০৪৬ (৯৫ KB) | smartcommons>Cloud200 | Cross-wiki upload from en.wikipedia.org |
ꯐꯥꯏꯜꯒꯤ ꯁꯤꯖꯤꯟꯅꯐꯝ
ꯃꯁꯤꯒꯤ ꯐꯥꯏꯜ ꯁꯤ ꯁꯤꯖꯤꯟꯅꯕ ꯂꯃꯥꯏꯁꯤꯡ ꯂꯩꯇꯦ ꯫
.png)