ꯐꯥꯏꯜ:Berg Ostry 2011 Chart 4.gif

ꯃꯁꯤꯒꯤ ꯄ꯭ꯔꯚꯤꯌꯨ ꯑꯁꯤꯒꯤ ꯁꯥꯏꯓ: ২২০ × ১১৯ ꯄꯤꯛꯆꯦꯜꯁ. ꯑꯇꯩ ꯁꯦꯡꯅ ꯌꯦꯡꯕ ꯌꯥꯕ: ৩২০ × ১৭৩ ꯄꯤꯛꯆꯦꯜꯁ | ৯৭৮ × ৫২৮ ꯄꯤꯛꯆꯦꯜꯁ.
ꯐꯥꯏꯜ ꯑꯁꯦꯡꯕ (৯৭৮ × ৫২৮ ꯄꯤꯛꯆꯦꯜꯁ, ꯐꯥꯏꯜ ꯆꯥꯎꯕꯒꯤ ꯆꯥꯡ: ১১ KB, MIME ꯃꯈꯜ: image/gif)


ꯑꯇꯦꯟꯕꯥ ꯁꯟꯗꯣꯛꯅꯥ ꯇꯥꯛꯄꯥ
| ꯁꯟꯗꯣꯛꯅꯥ ꯇꯥꯛꯄꯥBerg Ostry 2011 Chart 4.gif |
English: Percentage changes in GDP growth spell length as each factor moves from 50th to 60th percentile and all other factors are held constant. Income distribution is measured by the Gini coefficient. Political institutions are measured by the Polity IV Project scale. Exchange rate competitiveness is measured by rate deviation from purchasing power parity adjusted for per capita income. |
| ꯆꯩꯆꯠ | |
| ꯍꯧꯔꯛꯐꯛ | "Equality and Efficiency" Finance and Development, September 2011, Vol. 48, No. 3 |
| ꯄꯨꯊꯣꯛꯂꯤꯕ ꯃꯤ | Andrew G. Berg and Jonathan D. Ostry, International Monetary Fund |
ꯑꯌꯥꯕꯥ
| Public domainPublic domainfalsefalse |

|
This work is ineligible for copyright and therefore in the public domain because it consists entirely of information that is common property and contains no original authorship. |
Captions
Add a one-line explanation of what this file represents
ꯐꯥꯏꯜꯒꯤ ꯄꯨꯋꯥꯔꯤ
ꯆꯩꯆꯠ/ꯃꯇꯝꯗ ꯅꯝꯃꯨ ꯃꯇꯝ ꯑꯗꯨꯗ ꯐꯥꯏꯜ ꯑꯗꯨ ꯎꯅꯕ
| ꯆꯩꯆꯠ/ꯃꯇꯝ | ꯈꯨꯠꯄꯤꯈꯨꯖꯤꯟ | ꯄꯥꯛ ꯆꯥꯎꯕꯥ | ꯁꯤꯖꯤꯟꯅꯔꯤꯕ | ꯑꯄꯥꯝꯕ ꯐꯣꯡꯗꯣꯛ ꯎ | |
|---|---|---|---|---|---|
| ꯍꯧꯖꯤꯛꯀꯤ | ꯲꯱:꯱꯶, ꯳ ꯐꯦꯕꯨꯋꯥꯔꯤ ꯲꯰꯱꯴ | 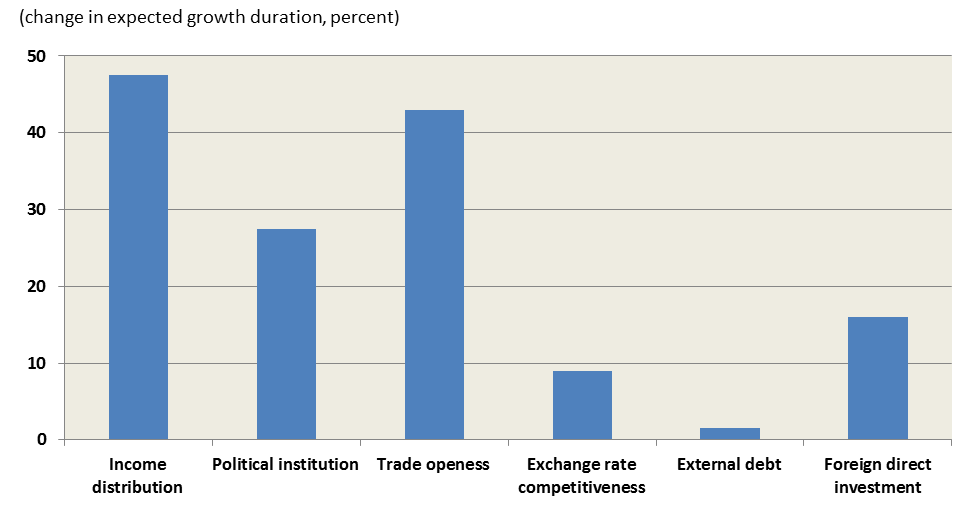 | ৯৭৮ × ৫২৮ (১১ KB) | smartcommons>Mattnad | Now with white background for legibility |
ꯐꯥꯏꯜꯒꯤ ꯁꯤꯖꯤꯟꯅꯐꯝ
ꯃꯁꯤꯒꯤ ꯐꯥꯏꯜ ꯁꯤ ꯁꯤꯖꯤꯟꯅꯕ ꯂꯃꯥꯏꯁꯤꯡ ꯂꯩꯇꯦ ꯫
