ꯐꯥꯏꯜ:Sachin Tendulkar graph.svg

Size of this PNG preview of this SVG file: ২১৯ × ৬১ ꯄꯤꯛꯆꯦꯜꯁ. ꯑꯇꯩ ꯔꯤꯁꯣꯂꯨꯁꯟ: ৩২০ × ৮৯ ꯄꯤꯛꯆꯦꯜꯁ.
ꯐꯥꯏꯜ ꯑꯁꯦꯡꯕ (ꯑꯦꯁ•ꯚꯤ•ꯖꯤ ꯐꯥꯏꯜ, ꯌꯥꯝꯗꯅ ৬,৭৯৮ × ১,৯০০ ꯄꯤꯛꯆꯦꯜ, ꯐꯥꯏꯜ ꯆꯥꯎꯕꯒꯤ ꯆꯥꯡ: ৩১ KB)
ꯑꯇꯦꯟꯕꯥ ꯁꯟꯗꯣꯛꯅꯥ ꯇꯥꯛꯄꯥ
| ꯁꯟꯗꯣꯛꯅꯥ ꯇꯥꯛꯄꯥSachin Tendulkar graph.svg |
English: SVG version of Sachin Tendulkar graph.png, which is also updated. It details the Test cricket performance of Sachin Tendulkar. The bars indicate the runs scored in each innings. Red bars indicate innings where the player has been dismissed, green bars indicate innings where he finished not out. The blue line shows the batting average of the ten most recent innings at that point. (this cannot be calculated for the first 9 innings). Created with this automated script using this data from howstat.com.au. (Older versions created with Inkscape) |
| ꯆꯩꯆꯠ | |
| ꯍꯧꯔꯛꯐꯛ | Own work based on: Sachin Tendulkar graph.png |
| ꯄꯨꯊꯣꯛꯂꯤꯕ ꯃꯤ | Raven4x4x |
| SVG genesis InfoField |  This chart was created with unknown tool. This chart was created with unknown tool. |


ꯑꯌꯥꯕꯥ
| Public domainPublic domainfalsefalse |

|
This work has been released into the public domain by its author, Raven4x4x. This applies worldwide. In some countries this may not be legally possible; if so: |
Captions
Add a one-line explanation of what this file represents
The file shows Sachin Tendulkar's batting performances in test matches
ꯐꯥꯏꯜꯒꯤ ꯄꯨꯋꯥꯔꯤ
ꯆꯩꯆꯠ/ꯃꯇꯝꯗ ꯅꯝꯃꯨ ꯃꯇꯝ ꯑꯗꯨꯗ ꯐꯥꯏꯜ ꯑꯗꯨ ꯎꯅꯕ
| ꯆꯩꯆꯠ/ꯃꯇꯝ | ꯈꯨꯠꯄꯤꯈꯨꯖꯤꯟ | ꯄꯥꯛ ꯆꯥꯎꯕꯥ | ꯁꯤꯖꯤꯟꯅꯔꯤꯕ | ꯑꯄꯥꯝꯕ ꯐꯣꯡꯗꯣꯛ ꯎ | |
|---|---|---|---|---|---|
| ꯍꯧꯖꯤꯛꯀꯤ | ꯱꯱:꯲꯷, ꯲꯷ ꯃꯥꯔꯆ ꯲꯰꯱꯴ | 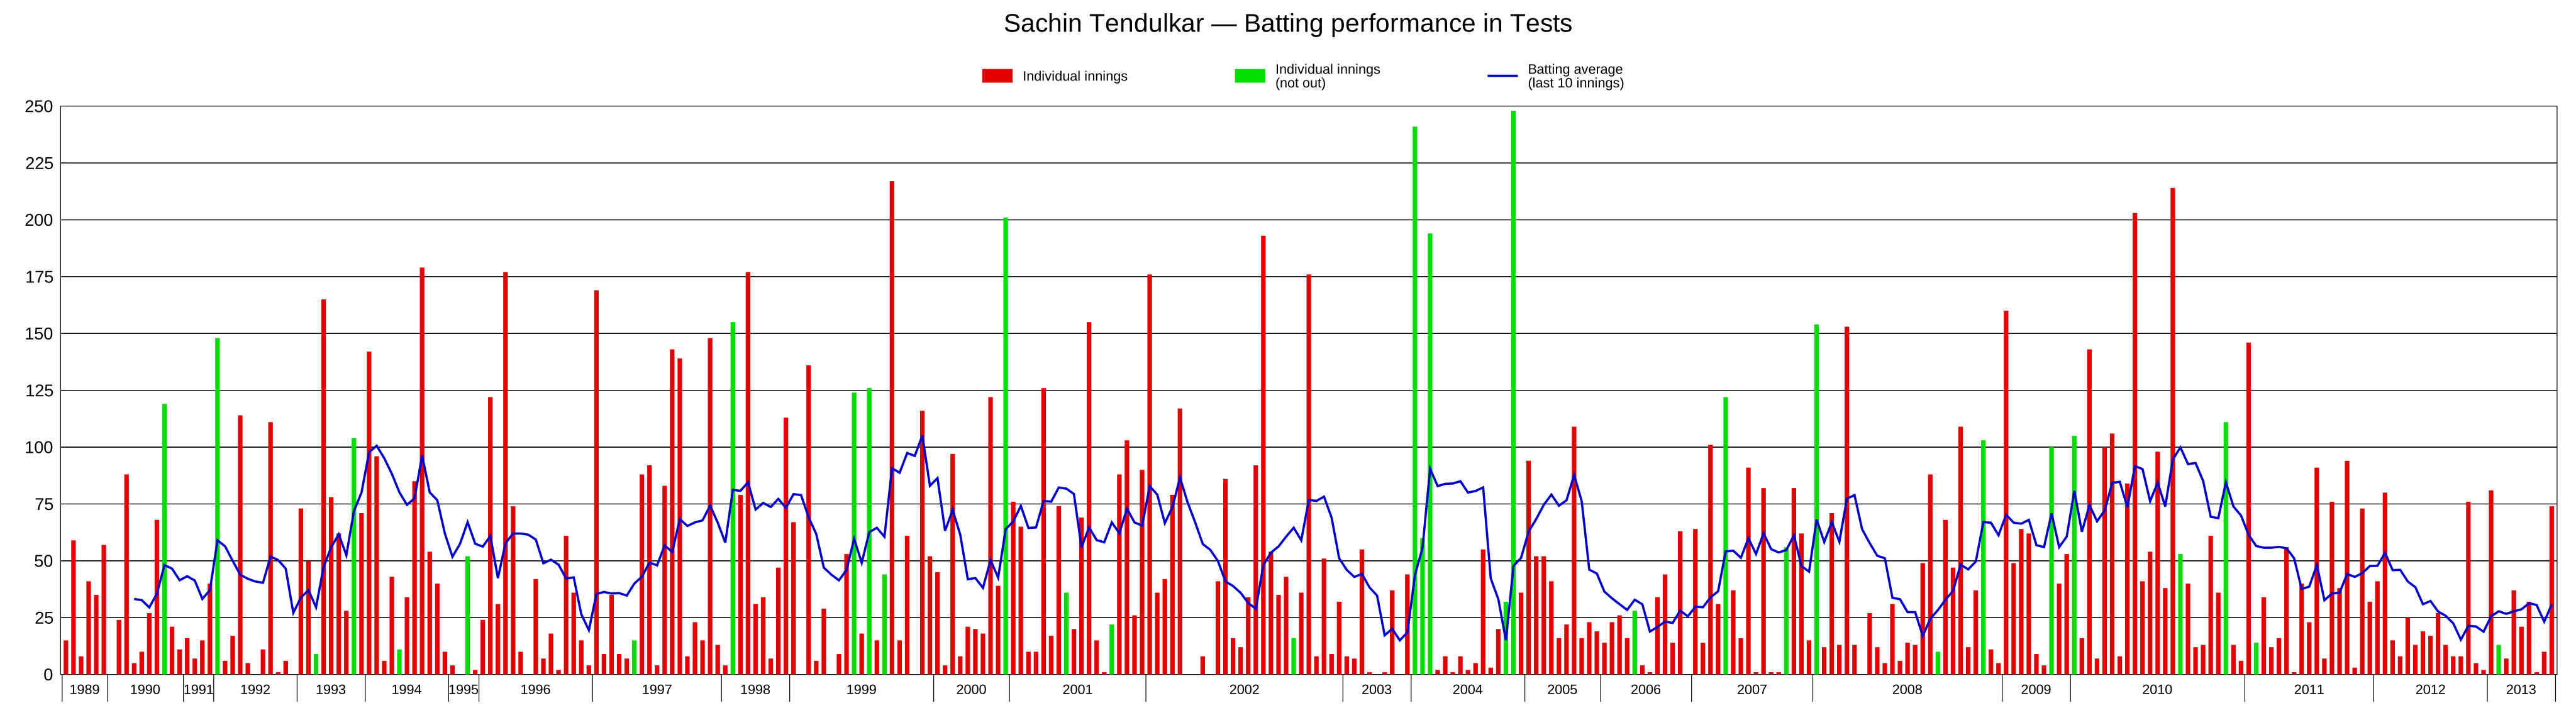 | ৬,৭৯৮ × ১,৯০০ (৩১ KB) | smartcommons>Jfd34 | Change the colour of the blue line to a darker colour |
ꯐꯥꯏꯜꯒꯤ ꯁꯤꯖꯤꯟꯅꯐꯝ
ꯃꯁꯤꯒꯤ ꯐꯥꯏꯜ ꯁꯤ ꯁꯤꯖꯤꯟꯅꯕ ꯂꯃꯥꯏꯁꯤꯡ ꯂꯩꯇꯦ ꯫
