ꯐꯥꯏꯜ:US Unemployment measures.svg

Size of this PNG preview of this SVG file: ২২০ × ১৬৫ ꯄꯤꯛꯆꯦꯜꯁ. ꯑꯇꯩ ꯔꯤꯁꯣꯂꯨꯁꯟ: ৩২০ × ২৪০ ꯄꯤꯛꯆꯦꯜꯁ.
ꯐꯥꯏꯜ ꯑꯁꯦꯡꯕ (ꯑꯦꯁ•ꯚꯤ•ꯖꯤ ꯐꯥꯏꯜ, ꯌꯥꯝꯗꯅ ৭২০ × ৫৪০ ꯄꯤꯛꯆꯦꯜ, ꯐꯥꯏꯜ ꯆꯥꯎꯕꯒꯤ ꯆꯥꯡ: ১৫৪ KB)

ꯑꯇꯦꯟꯕꯥ ꯁꯟꯗꯣꯛꯅꯥ ꯇꯥꯛꯄꯥ
| ꯁꯟꯗꯣꯛꯅꯥ ꯇꯥꯛꯄꯥUS Unemployment measures.svg |
English: Bureau of Labor Statistics measurements U1, U2, U3, U4, U5 and U6. |
| ꯆꯩꯆꯠ | |
| ꯍꯧꯔꯛꯐꯛ | ꯏꯁꯥ ꯏꯊꯟꯇꯒꯤ ꯑꯣꯏꯕꯥ ꯊꯕꯛ |
| ꯄꯨꯊꯣꯛꯂꯤꯕ ꯃꯤ | Autopilot |
Source
- data from http://download.bls.gov/pub/time.series/ln/ln.data.1.AllData
- field names from http://download.bls.gov/pub/time.series/ln/ln.series
# parse out just the ones that we care about: U1, U2, U3, U4, U5 and U6
# The AllData file has 4.2 million rows, of which can take some time to
# load, so it is commented out for repeated plots.

if (F) {
	cat("Loading table -- might take some time\n");
	u <- read.table("ln.data.1.Alldata", header=T, fill=T)
	u$time <- u$year + (as.numeric(u$period) - 1) / 12

	cat("Processing -- might take some time\n");
	u1 = subset(u, series_id == "LNS13025670")
	u2 = subset(u, series_id == "LNS14023621")
	u3 = subset(u, series_id == "LNS14000000")
	u4 = subset(u, series_id == "LNS13327707")
	u5 = subset(u, series_id == "LNS13327708")
	u6 = subset(u, series_id == "LNS13327709")
}

par(family="Times")
par(bty = "n")
plot(
	0,
	main = "Measurement of unemployment",
	ylim = c(0,18),
	xlim = c(1950, 2010),
	xlab = "Year",
	ylab = "Percentage",
	las = 1
);

grid()

pal = rainbow(8)
lines(value ~ time, u6, col=pal[6])
lines(value ~ time, u5, col=pal[5])
lines(value ~ time, u4, col=pal[4])
lines(value ~ time, u3, col=pal[3])
lines(value ~ time, u2, col=pal[2])
lines(value ~ time, u1, col=pal[1])

legend(
	"topleft",
	rev(c(
		"U1: Percent Of Civilian Labor Force Unemployed 15 Weeks and over",
		"U2: Unemployment Rate - Job Losers",
		"U3: Unemployment Rate",
		"U4: All of U3, plus discouraged workers",
		"U5: All of U4, plus marginally attached workers",
		"U6: All of U5, plus total employed part time for economic reasons"
	)),
	col = rev(pal[1:6]),
	bty = 'n',
	lty = 1
)

dev.copy(svg, "US Unemployment measures.svg", width=8, height=6)
dev.off()
ꯑꯌꯥꯕꯥ
I, the copyright holder of this work, hereby publish it under the following licenses:


ꯐꯥꯏꯜ ꯑꯁꯤ ꯀ꯭ꯔꯤꯌꯦꯇꯤꯚ ꯀꯣꯃꯣꯟꯁꯀꯤ Attribution-Share Alike 3.0 Unported ꯑꯌꯥꯕꯒꯤ ꯃꯈꯥꯗ ꯌꯥꯎꯕꯅꯤ ꯫
- ꯅꯪꯒꯤ ꯀꯨꯁꯤ:
- ꯃꯌꯥꯝꯗꯥ ꯐꯪꯍꯟꯕꯥ – ꯊꯥꯕꯛ ꯑꯗꯨ ꯁꯤꯟꯖꯤꯟꯕꯥ, ꯌꯦꯟꯊꯣꯛ ꯎ ꯑꯃꯥꯗꯤ ꯃꯐꯝ ꯱ ꯗꯥ ꯆꯠꯍꯟꯂꯨ
- ꯑꯃꯨꯛꯀꯥ ꯌꯥꯟꯁꯤꯟꯅꯍꯟꯕꯥ – ꯊꯥꯕꯛꯇꯨꯒꯥ ꯆꯨꯁꯤꯟꯅꯍꯟꯕꯥ
- ꯃꯈꯥꯒꯤ ꯌꯥꯅꯕꯒꯤ ꯃꯈꯥ ꯄꯣꯟꯅ:
- ꯈꯣꯝꯒꯠꯂꯛꯄꯥ – ꯅꯪꯅ ꯆꯞꯆꯥꯕ ꯇꯧꯕꯤꯃꯜ ꯄꯤꯕꯤꯒꯗꯕꯅꯤ, ꯑꯌꯥꯕ ꯄꯤꯔꯤꯕꯁꯤꯡꯒ ꯁꯝꯅꯐꯝ ꯄꯤꯒꯗꯕꯅꯤ ꯑꯃꯁꯨꯡ ꯑꯍꯣꯡꯕ ꯈꯔꯥ ꯂꯩꯔꯗꯤ ꯃꯗꯨ ꯎꯠꯀꯗꯕꯅꯤ ꯫ ꯅꯪꯅ ꯃꯗꯨ ꯃꯔꯝ ꯂꯩꯅ ꯇꯧꯒꯗꯕꯅꯤ, ꯑꯗꯨꯕꯨ ꯑꯌꯥꯕ ꯄꯥꯏꯔꯤꯕꯗꯨꯅ ꯍꯥꯏꯔꯛꯄ ꯃꯑꯣꯡ ꯅꯠꯇ꯭ꯔꯒ ꯅꯪꯅ ꯁꯤꯖꯤꯟꯅꯕ ꯃꯑꯣꯡꯗ ꯇꯧꯔꯣꯏꯗꯕꯅꯤ ꯫
- ꯃꯥꯟꯅꯕꯥ ꯁꯥꯔꯨꯛ – ꯀꯔꯤꯒꯨꯝꯅ ꯅꯪꯅ ꯌꯥꯟꯁꯤꯟꯅꯔꯕ, ꯍꯣꯡꯗꯣꯛꯍꯟꯂꯕ, ꯅꯠꯇ꯭ꯔꯒ ꯄꯣꯠꯆꯪꯁꯤꯡ ꯁꯥꯒꯠꯂꯕꯗꯤ, ꯅꯪꯒꯤ ꯍꯣꯠꯅꯖꯃꯟ ꯑꯗꯨ ꯃꯁꯤꯒꯤ same or compatible licenseꯒꯤ

|
ꯁꯤꯟꯗꯣꯛꯅꯕ ꯑꯌꯥꯕꯗꯨ ꯄꯤꯔꯦ, ꯌꯦꯟꯊꯣꯛꯎ ꯑꯃꯁꯨꯡ/ꯅꯠꯇ꯭ꯔꯒ ꯃꯑꯣꯡ ꯱ꯗ ꯁꯦꯝꯗꯣꯛꯎ ꯃꯁꯤꯒꯤ ꯐꯥꯏꯜ ꯑꯁꯤ ꯖꯤ•ꯑꯦꯟ•ꯌꯨ ꯃꯃꯜ ꯇꯤꯡꯗꯕ ꯗꯣꯀꯨꯃꯦꯟꯇꯦꯁꯟꯒꯤ ꯑꯌꯥꯕ ꯌꯥꯅꯕꯒꯤ ꯃꯈꯥꯗ, ꯚꯔꯖꯟ ꯱.꯲ ꯅꯠꯇ꯭ꯔꯒ ꯇꯨꯡꯗ ꯂꯥꯛꯀꯗꯕ ꯚꯔꯖꯟ Free Software Foundationꯅ ꯐꯣꯡꯗꯣꯛꯂꯕ; ꯂꯣꯏꯅꯅ ꯈꯦꯠꯅꯕ ꯁꯔꯨꯛꯁꯤꯡ ꯌꯥꯎꯗꯅ, ꯂꯥꯏꯔꯤꯛꯀꯤ ꯃꯃꯥꯡꯒꯤ ꯃꯈꯨꯝ ꯌꯥꯎꯗꯕꯤ, ꯑꯃꯗꯤ ꯂꯥꯏꯔꯤꯛꯀꯤ ꯑꯔꯣꯏꯕ ꯆꯦꯈꯨꯝ ꯌꯥꯎꯗꯕꯤ ꯫ ꯁꯤꯟꯗꯣꯛꯄ ꯌꯥꯕꯒꯤ ꯑꯌꯥꯕꯁꯤꯡꯁꯤ GNU Free Documentation Licenseꯒꯤ ꯁ꯭ꯔꯨꯛꯁꯤꯡꯗ ꯌꯥꯎꯔꯦ ꯫http://www.gnu.org/copyleft/fdl.htmlGFDLGNU Free Documentation Licensetruetrue |
ꯅꯪ ꯅꯁꯥꯅꯥ ꯃꯁꯤꯒꯤ ꯑꯌꯥꯕꯁꯤ ꯈꯟꯕꯥ ꯌꯥꯅꯤ ꯫
Captions
Add a one-line explanation of what this file represents
ꯐꯥꯏꯜꯒꯤ ꯄꯨꯋꯥꯔꯤ
ꯆꯩꯆꯠ/ꯃꯇꯝꯗ ꯅꯝꯃꯨ ꯃꯇꯝ ꯑꯗꯨꯗ ꯐꯥꯏꯜ ꯑꯗꯨ ꯎꯅꯕ
| ꯆꯩꯆꯠ/ꯃꯇꯝ | ꯈꯨꯠꯄꯤꯈꯨꯖꯤꯟ | ꯄꯥꯛ ꯆꯥꯎꯕꯥ | ꯁꯤꯖꯤꯟꯅꯔꯤꯕ | ꯑꯄꯥꯝꯕ ꯐꯣꯡꯗꯣꯛ ꯎ | |
|---|---|---|---|---|---|
| ꯍꯧꯖꯤꯛꯀꯤ | ꯱꯱:꯳꯰, ꯲ ꯃꯥꯔꯆ ꯲꯰꯱꯶ | 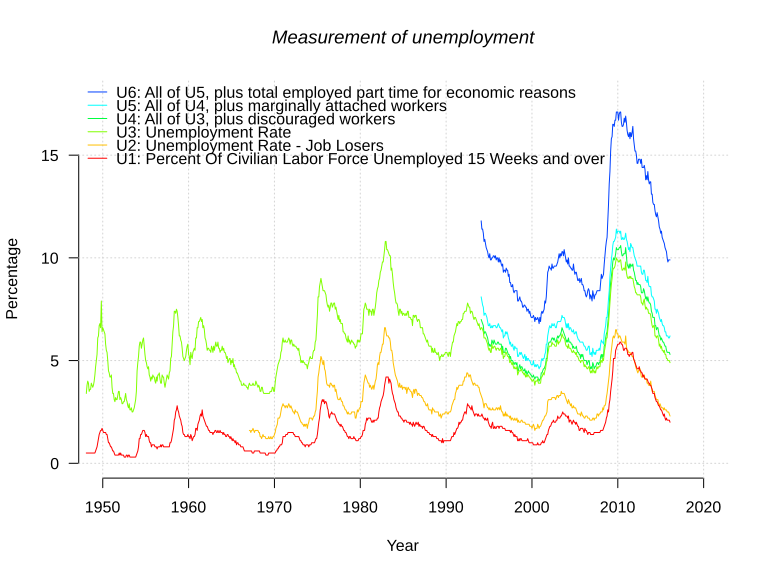 | ৭২০ × ৫৪০ (১৫৪ KB) | smartcommons>Kopiersperre | data until 2016.083 |
ꯐꯥꯏꯜꯒꯤ ꯁꯤꯖꯤꯟꯅꯐꯝ
ꯃꯁꯤꯒꯤ ꯐꯥꯏꯜ ꯁꯤ ꯁꯤꯖꯤꯟꯅꯕ ꯂꯃꯥꯏꯁꯤꯡ ꯂꯩꯇꯦ ꯫
